
If you have ever seen your WordPress or WooCommerce site running at 100% CPU usage while real visitor numbers stay low, you are not alone. This issue is very common, and the real cause often is not your customers. It is the bots.
The Mystery: High CPU but Low Traffic
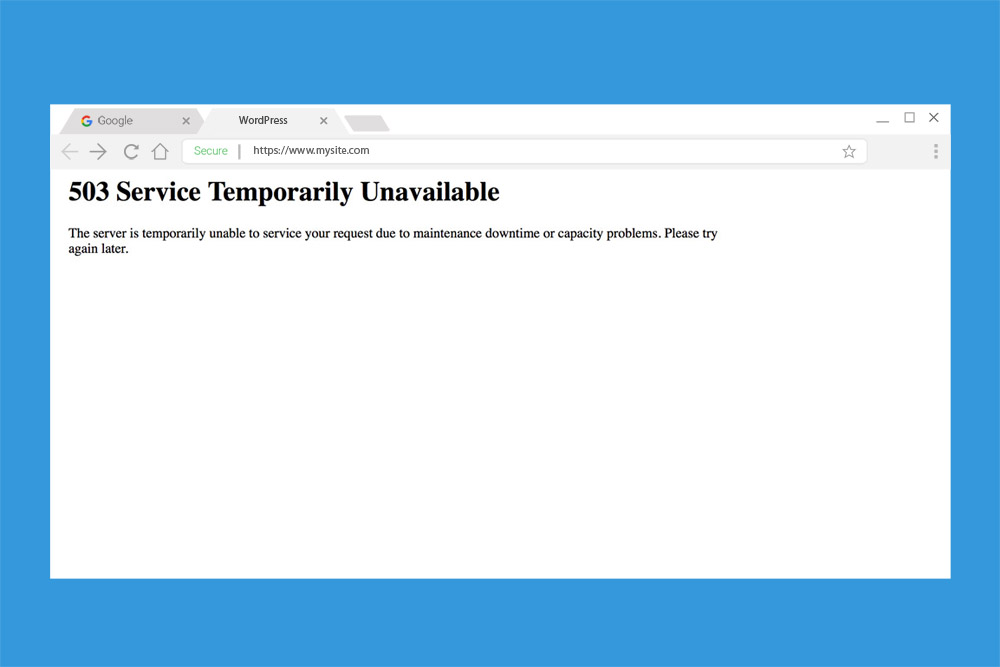
At first, the situation seems strange. Your analytics show only a few hundred visitors per day, but the server CPU stays close to 100%. You try upgrading your plan, adding more RAM or CPU cores, yet performance does not improve. The site remains slow, and PHP-FPM and MySQL are always busy.
When you finally check your server logs, you find thousands of requests every few minutes, many coming from automated bots or crawlers.
How Bots Overload WordPress
WordPress and WooCommerce depend heavily on PHP and MySQL. Every page request triggers database queries, object loading, and dynamic rendering. When dozens of bots crawl your website at the same time, they cause:
- Full PHP page loads for every hit
- Cache misses, bypassing Redis or object cache
- Expensive MySQL queries that repeat constantly
- Continuous PHP-FPM worker usage
Even “friendly” crawlers such as search engine bots or analytics scrapers can cause massive load when they request dynamic content too frequently.
Why Adding Resources Does Not Help
The typical reaction is to add resources: more RAM, more CPU cores, or better hosting. While caching plugins like WP Rocket, W3 Total Cache, or Redis Object Cache help, they do not eliminate the root problem. PHP still has to process every request that reaches the server.
So even after optimization, CPU usage remains high because the server is flooded with unnecessary requests that never come from real users.
The Real Fix: Smart Traffic Filtering
The real solution begins when you identify the source of the load. In most cases, the problem is excessive non-human traffic from unknown IPs pretending to be browsers.
Instead of endlessly upgrading your server, the better strategy is to filter traffic at the edge using Cloudflare WAF (Web Application Firewall).
Using Cloudflare to Protect WordPress
Cloudflare lets you define custom firewall rules that decide who can access your site before requests ever reach PHP. Here is how you can fix the issue step by step.
1. Challenge non-local traffic
Start by challenging or blocking foreign IP addresses that are not legitimate bots. Example rule for a US-based website:
(not ip.geoip.country in {"US"}) and (not cf.client.bot)This allows valid bots like Google, Bing, and Yandex but challenges others.
2. Keep important WordPress paths open
You must not block WordPress and WooCommerce system paths or your store will break. Keep these accessible:
/wp-content/
/wp-includes/
/wp-json/
/xmlrpc.php
/wp-admin/admin-ajax.php
A full Cloudflare rule could look like this:
(not ip.geoip.country in {"US"})
and (not cf.client.bot)
and (not http.request.uri.path contains "/wp-json")
and (not http.request.uri.path contains "/xmlrpc.php")
and (not http.request.uri.path contains "/wp-content")
and (not http.request.uri.path contains "/wp-includes")
and (not http.request.uri.path contains "/wp-admin/admin-ajax.php")
This ensures your site’s media, APIs, and dynamic AJAX calls continue to work for legitimate users and integrations.
The Result
After applying these rules, CPU usage drops significantly. Redis and PHP-FPM return to normal levels, and real visitors experience faster page loads. WooCommerce checkout, cart, and product pages continue to work correctly. Meanwhile, unwanted bot traffic is filtered at Cloudflare before reaching your server.
Bonus Tip: Separate the WooCommerce API
For large stores, you can separate the WooCommerce REST API onto a dedicated subdomain such as:
api.yourstore.comThen use Cloudflare to allow that subdomain globally while keeping the main site protected. This prevents background API traffic from affecting customer performance.
Server Monitoring and Diagnostic Commands
If you want to diagnose a high CPU problem before making Cloudflare changes, these terminal commands help you understand what is happening.
1. Check CPU and PHP-FPM usage
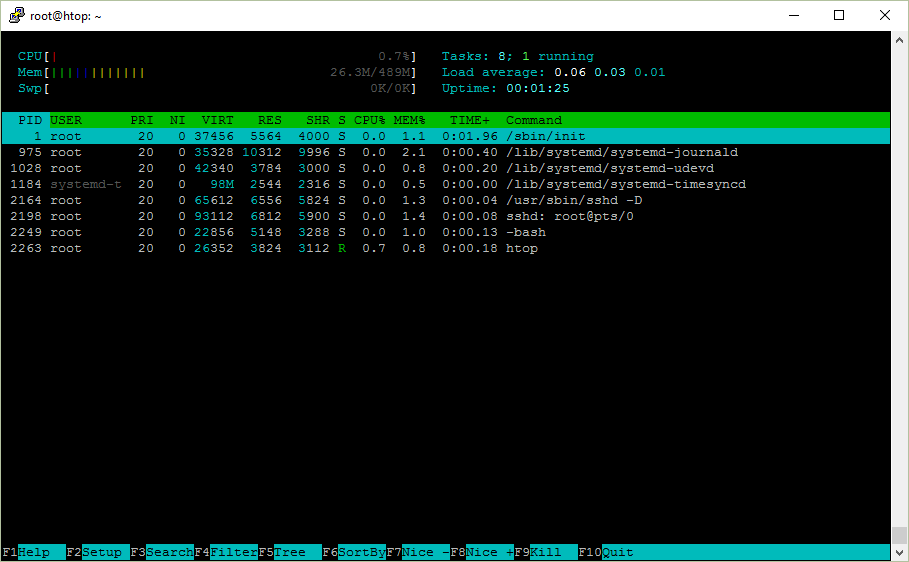
htop
ps -eo pid,cmd,%cpu,%mem --sort=-%cpu | head -20
pidstat -u 1
Monitor active PHP-FPM workers:
grep -E 'max_children|pm\.status_path' /etc/php/*/fpm/pool.d/www.conf
curl -s 127.0.0.1/status
2. Inspect web traffic and bots
# Most frequent IPs in the last 2 minutes
awk -v d="$(date -d '2 minutes ago' '+%d/%b/%Y:%H:%M')" '$4 > "["d {print $1}' /var/log/nginx/access.log | sort | uniq -c | sort -nr | head -20

# Number of bots in the last 5 minutes
awk -v d="$(date -d '5 minutes ago' '+%d/%b/%Y:%H:%M')" -F\" '$4 > "["d && ($(NF-1) ~ /bot|crawler|spider|bing|google|meta|facebook|Claude|Ahrefs|Semrush|Yandex/i){c++} END{print c+0}' /var/log/nginx/access.log

# Check Cloudflare headers
curl -I https://example.com/ | egrep -i 'cf-ray|server|cf-cache-status'
3. Monitor Redis performance
redis-cli info stats | grep ops_per_sec
redis-cli info commandstats | grep cmdstat_ | sort -t= -k3 -nr | head -15
redis-cli info memory | egrep 'used_memory_human|maxmemory|maxmemory_policy'
redis-cli slowlog get 10
If ops_per_sec is too high or set/get commands are in the millions, the site is being hammered by frequent requests (often due to bots or inefficient caching).
4. Analyze MySQL load
mysql -u USER -p
SHOW PROCESSLIST;
SHOW ENGINE INNODB STATUS\G;
SHOW STATUS LIKE 'Threads_connected';
SET GLOBAL slow_query_log = 'ON';
SET GLOBAL long_query_time = 0.5;
SET GLOBAL slow_query_log_file = '/var/log/mysql/slow.log';
View recent slow queries:
tail -n 200 /var/log/mysql/slow.log | grep -E 'Query_time|SELECT' | tail -n 60
EXPLAIN SELECT ... ;
5. Identify WooCommerce AJAX overload
grep -c 'wc-ajax=' /var/log/nginx/access.log
awk -F\" '{print $2}' /var/log/nginx/access.log | awk '{print $2}' | sort | uniq -c | sort -nr | head -30
6. Correlate traffic and CPU load
Run these in two terminals:
Terminal 1:
watch -n 2 'ps -eo pid,cmd,%cpu --sort=-%cpu | head'Terminal 2:
watch -n 2 'awk -v d="$(date -d "2 minutes ago" "+%d/%b/%Y:%H:%M")" "$4 > \"[\"d {print \$1}" /var/log/nginx/access.log | sort | uniq -c | sort -nr | head'If CPU spikes match increased IP activity, you have confirmation of external load (usually bots).
Final Thoughts
High CPU usage on WordPress and WooCommerce servers is often caused by uncontrolled bot activity, not real customers. By combining caching with Cloudflare’s smart firewall rules and monitoring your server with Redis, MySQL, and Nginx logs, you can:
- Detect and stop resource abuse
- Lower CPU and RAM consumption
- Keep your store fast for real users
- Maintain full access for Google and legitimate crawlers
Stop fighting bots with more hardware. Use smart edge filtering and proactive monitoring to keep your WordPress site healthy and efficient.